Bitcoin
Models
Indicators
Cycles
HODL
Volatility
Realized Price
Monetary Data
Transactions & Mining
Volume & Fees
Performance Comparison
International
Block Explorer
Bitcoin Reserves
Exchanges
ETFs
Miners
National
Corporate
Bitcoin Distribution
Inequality
Stacked Charts
By Address Tier
By Minimum Balance
By Maximum Balance
By Balance Range
Bitcoin Correlations
Stocks
ETFs
Commodities
Indices
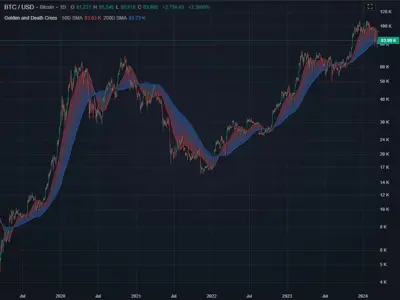
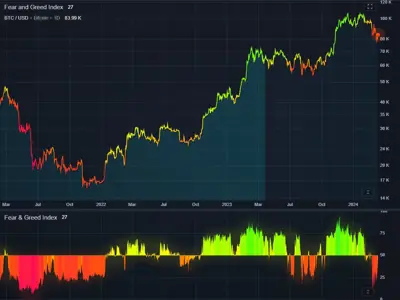
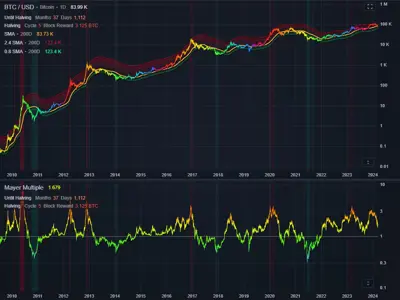
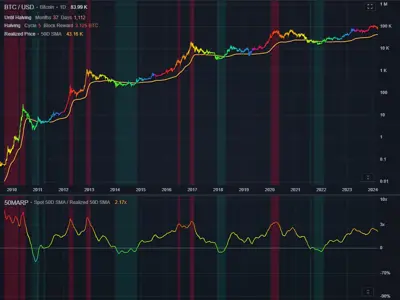
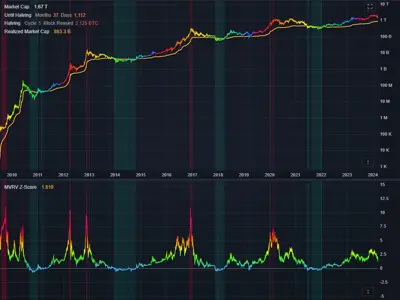
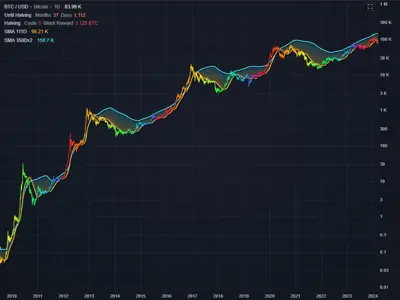
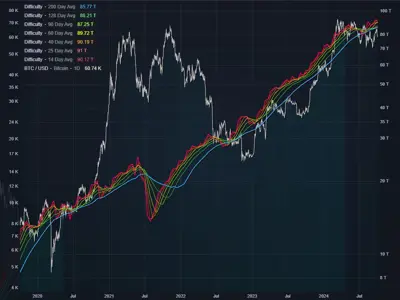
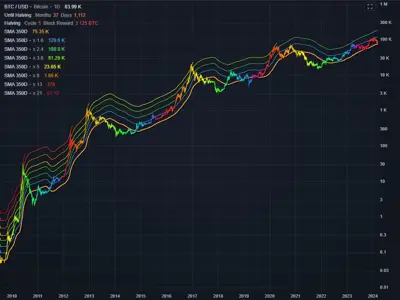
Equilibrium Bubble RiskBull Market Support BandBitcoin Golden and Death CrossFear & Greed IndexNVT RatioNVT Signal (NVTS)Puell MultiplePuell Multiple (Normalized)Mayer MultipleMayer Multiple (Normalized)Difficulty Ribbon50MARPMVRV Z-ScorePi Cycle TopGolden Ratio Multiplier
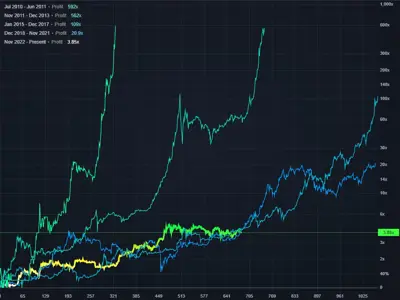
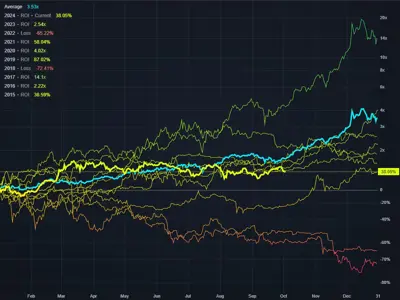
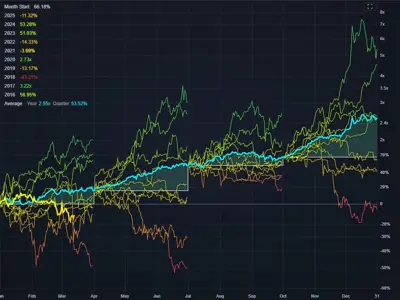
Bull and Bear MarketsBitcoin Halving CyclesBull Markets | Bottom to TopBear Markets | Top to BottomCycles | Top to TopCycles | Halving to HalvingCycles | Bottom to BottomMonthly Return on Investment (ROI)Quarterly Return on Investment (ROI)Yearly Return on Investment (ROI)
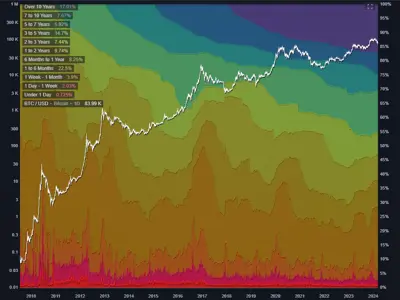
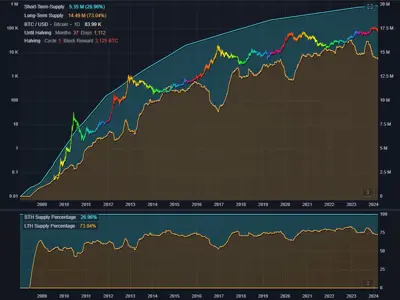
HODL WavesLong vs Short Term SupplyLong-Term Hodl WaveShort-Term Hodl WaveUnder 1 Day Hodl Wave1 Day - 1 Week Hodl Wave1 Week - 1 Month Hodl Wave1 to 6 Months Hodl Wave6 Months to 1 Year Hodl Wave1 to 2 Years Hodl Wave2 to 3 Years Hodl Wave3 to 5 Years Hodl Wave5 to 7 Years Hodl Wave7 to 10 Years Hodl Wave1+ Year Hodl Wave2+ Years Hodl Wave3+ Years Hodl Wave5+ Years Hodl Wave7+ Years Hodl WaveOver 10 Years Hodl Wave
Price Volatility | 10 DaysPrice Volatility | 30 DaysPrice Volatility | 60 DaysPrice Volatility | 90 DaysPrice Volatility | 180 DaysPrice Volatility | 1 Year
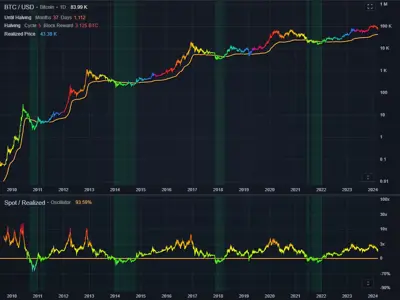
Realized PriceLong-Term Realized PriceShort-Term Realized Price1+ Year Realized PriceUnder 1 Day1 Day - 1 Week1 Week - 1 Month1 to 6 Months6 Months to 1 Year1 to 2 Years2 to 3 Years3 to 5 Years5 to 7 Years7 to 10 YearsOver 10 Years
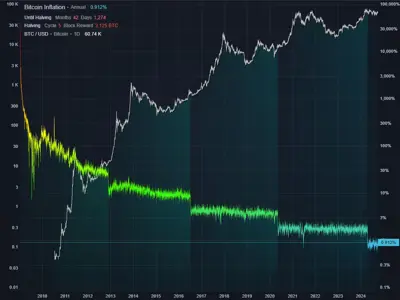
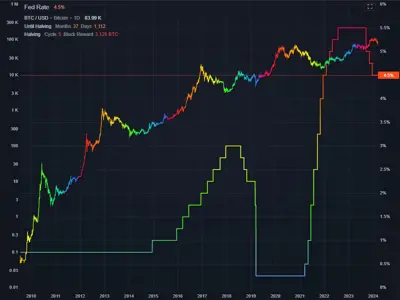
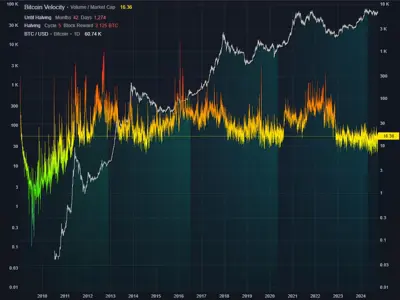
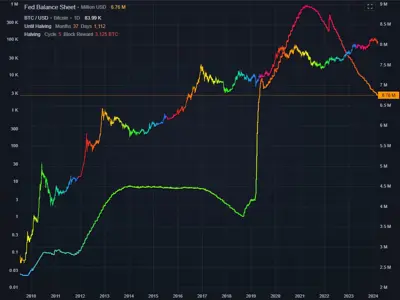
InflationStock-to-Flow (S2F)VelocityFed RateFed Balance Sheet
Total Supply
Bitcoin Circulating Supply (BTC)Bitcoin Circulating Supply PercentageBitcoin Remaining Supply (BTC)Bitcoin Remaining Supply Percentage
New Supply (BTC)
Daily New Supply (BTC)Weekly New Supply (BTC)Monthly New Supply (BTC)Quarterly New Supply (BTC)Yearly New Supply (BTC)
New Supply (USD)
Blocks
Transactions
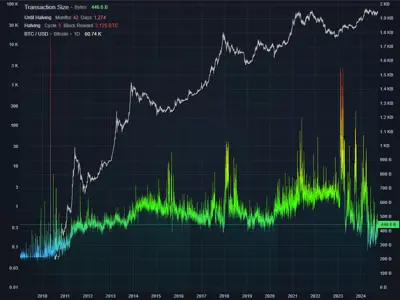
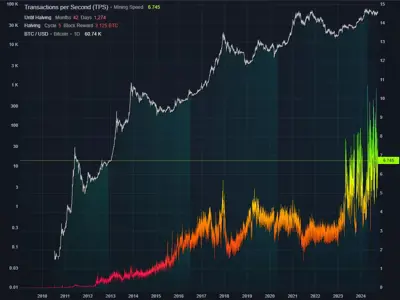
Transaction SizeTransactions per BlockTransactions per Second (TPS)Transactions per MinuteTransactions per HourTransactions per DayTransactions per WeekTransactions per MonthTransactions per Year
Network Security
Miners Revenue (BTC)
Miners Revenue per Hour (BTC)Miners Revenue per Day (BTC)Miners Revenue per Week (BTC)Miners Revenue per Month (BTC)Miners Revenue per Quarter (BTC)Miners Revenue per Year (BTC)
Miners Revenue (USD)
Transaction Fees (BTC)Transaction Fees (USD)Transaction Fees (% of Reward)
Aggregate Volume (BTC)
Aggregate Volume (USD)
Aggregate Fees (BTC)
Aggregate Fees (USD)
Bitcoin vs GoldBitcoin vs SilverBitcoin vs Crude OilBitcoin vs S&P 500Bitcoin vs NASDAQBitcoin vs Down JonesBitcoin vs MicroStrategyBitcoin vs AppleBitcoin vs Google (Alphabet)Bitcoin vs Facebook (META)Bitcoin vs NVIDIABitcoin vs TeslaBitcoin vs ARK Bitcoin ETFBitcoin vs Arm Holdings PLCBitcoin vs Bitwise Bitcoin ETFBitcoin vs CleanSpark IncBitcoin vs Fidelity Bitcoin ETFBitcoin vs Franklin Bitcoin ETFBitcoin vs Grayscale Bitcoin TrustBitcoin vs Grayscale Ethereum TrustBitcoin vs Galaxy Bitcoin ETFBitcoin vs iShares Ethereum ETFBitcoin vs ProShares Bitcoin ETFBitcoin vs SoundHound IncBitcoin vs Super Micro ComputerBitcoin vs Valkyrie Bitcoin ETFBitcoin vs VanEck Bitcoin ETF
BTC / AED (UAE Dirham)BTC / ARS (Argentine Peso)BTC / AUD (Australian Dollar)BTC / BGN (Bulgarian Lev)BTC / BHD (Bahraini Dinar)BTC / BND (Brunei Dollar)BTC / BRL (Brazilian Real)BTC / CAD (Canadian Dollar)BTC / CHF (Swiss Franc)BTC / CLP (Chilean Peso)BTC / CNY (Chinese Yuan)BTC / CZK (Czech Koruna)BTC / DKK (Danish Krone)BTC / EGP (Egyptian Pound)BTC / EUR (Euro)BTC / FJD (Fiji Dollar)BTC / GBP (Pound Sterling)BTC / HKD (Hong Kong Dollar)BTC / HUF (Hungarian Forint)BTC / IDR (Indonesian rRpiah)BTC / ILS (Israeli New Shekel)BTC / INR (Indian Rupee)BTC / JPY (Japanese Yen)BTC / KRW (South Korean Won)BTC / KWD (Kuwaiti Dinar)BTC / LKR (Sri Lankan Rupee)BTC / MAD (Moroccan Dirham)BTC / MGA (Malagasy Ariary)BTC / MXN (Mexican Peso)BTC / MYR (Malaysian Ringgit)BTC / NOK (Norwegian Krone)BTC / NZD (New Zealand Dollar)BTC / OMR (Omani Rial)BTC / PEN (Peruvian Sol)BTC / PGK (Papua New Guinean Kina)BTC / PHP (Philippine Peso)BTC / PKR (Pakistani Rupee)BTC / PLN (Polish Złoty)BTC / RUB (Russian Ruble)BTC / SAR (Saudi Riyal)BTC / SCR (Seychelles Rupee)BTC / SEK (Swedish Krona/Kronor)BTC / SGD (Singapore Dollar)BTC / THB (Thai Baht)BTC / TRY (Turkish Lira)BTC / TWD (New Taiwan Dollar)BTC / TZS (Tanzanian Shilling)BTC / USD (US Dollar)BTC / VND (Vietnamese Dồng)BTC / XOF (CFA Franc BCEAO)BTC / ZAR (South African Rand)
Exchange Reserves & FlowsBigONEBinanceBitZBitfinexBitgetBitMEXBitstampBittrexBybitCITEXCoinbaseCoincheckCoinSwitchCoinwCrypto.comFameEXgate.ioHTXKlickl(IDCM)JubiKorbitKrakenKuCoinMEXCOKXPhemexPoloniexWOO XXTZG.com
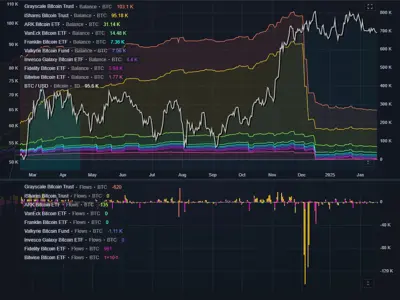
All Bitcoin ETFs (Total)All Bitcoin ETFs (Stacked)ARK Bitcoin ETFBitwise Bitcoin ETFFidelity Bitcoin ETFFranklin Bitcoin ETFGrayscale Bitcoin TrustInvesco Galaxy Bitcoin ETFiShares Bitcoin TrustValkyrie Bitcoin FundVanEck Bitcoin ETF
BTC Balance Tiers
USD Balance Tiers
Total Balance (BTC)
Top 5 AddressesTop 10 AddressesTop 25 AddressesTop 50 AddressesTop 100 AddressesTop 250 AddressesTop 500 AddressesTop 1,000 AddressesTop 5,000 AddressesTop 10,000 Addresses
Total Balance (USD)
Top 5 AddressesTop 10 AddressesTop 25 AddressesTop 50 AddressesTop 100 AddressesTop 250 AddressesTop 500 AddressesTop 1,000 AddressesTop 5,000 AddressesTop 10,000 Addresses
Average Balance (BTC)
Top 5 AddressesTop 10 AddressesTop 25 AddressesTop 50 AddressesTop 100 AddressesTop 250 AddressesTop 500 AddressesTop 1,000 AddressesTop 5,000 AddressesTop 10,000 Addresses
Average Balance (USD)
Top 5 AddressesTop 10 AddressesTop 25 AddressesTop 50 AddressesTop 100 AddressesTop 250 AddressesTop 500 AddressesTop 1,000 AddressesTop 5,000 AddressesTop 10,000 Addresses
Percentage of Supply
Number of Addresses
Balance0.000001 BTC or more0.00001 BTC or more0.0001 BTC or more0.001 BTC or more0.01 BTC or more0.1 BTC or more1 BTC or more10 BTC or more100 BTC or more1,000 BTC or more10,000 BTC or more100,000 BTC or more$0.01 USD or more$0.10 USD or more$1 USD or more$10 USD or more$100 USD or more$1,000 USD or more$10,000 USD or more$100,000 USD or more$1,000,000 USD or more$10,000,000 USD or more$100,000,000 USD or more$1,000,000,000 USD or more
Percentage of Addresses
Balance0.000001 BTC or more0.00001 BTC or more0.0001 BTC or more0.001 BTC or more0.01 BTC or more0.1 BTC or more1 BTC or more10 BTC or more100 BTC or more1,000 BTC or more10,000 BTC or more100,000 BTC or more$0.01 USD or more$0.10 USD or more$1 USD or more$10 USD or more$100 USD or more$1,000 USD or more$10,000 USD or more$100,000 USD or more$1,000,000 USD or more$10,000,000 USD or more$100,000,000 USD or more$1,000,000,000 USD or more
Total Balance (BTC)
Balance0.000001 BTC or more0.00001 BTC or more0.0001 BTC or more0.001 BTC or more0.01 BTC or more0.1 BTC or more1 BTC or more10 BTC or more100 BTC or more1,000 BTC or more10,000 BTC or more100,000 BTC or more$0.01 USD or more$0.10 USD or more$1 USD or more$10 USD or more$100 USD or more$1,000 USD or more$10,000 USD or more$100,000 USD or more$1,000,000 USD or more$10,000,000 USD or more$100,000,000 USD or more$1,000,000,000 USD or more
Total Balance (USD)
Balance0.000001 BTC or more0.00001 BTC or more0.0001 BTC or more0.001 BTC or more0.01 BTC or more0.1 BTC or more1 BTC or more10 BTC or more100 BTC or more1,000 BTC or more10,000 BTC or more100,000 BTC or more$0.01 USD or more$0.10 USD or more$1 USD or more$10 USD or more$100 USD or more$1,000 USD or more$10,000 USD or more$100,000 USD or more$1,000,000 USD or more$10,000,000 USD or more$100,000,000 USD or more$1,000,000,000 USD or more
Average Balance (BTC)
Balance0.000001 BTC or more0.00001 BTC or more0.0001 BTC or more0.001 BTC or more0.01 BTC or more0.1 BTC or more1 BTC or more10 BTC or more100 BTC or more1,000 BTC or more10,000 BTC or more100,000 BTC or more$0.01 USD or more$0.10 USD or more$1 USD or more$10 USD or more$100 USD or more$1,000 USD or more$10,000 USD or more$100,000 USD or more$1,000,000 USD or more$10,000,000 USD or more$100,000,000 USD or more$1,000,000,000 USD or more
Average Balance (USD)
Balance0.000001 BTC or more0.00001 BTC or more0.0001 BTC or more0.001 BTC or more0.01 BTC or more0.1 BTC or more1 BTC or more10 BTC or more100 BTC or more1,000 BTC or more10,000 BTC or more100,000 BTC or more$0.01 USD or more$0.10 USD or more$1 USD or more$10 USD or more$100 USD or more$1,000 USD or more$10,000 USD or more$100,000 USD or more$1,000,000 USD or more$10,000,000 USD or more$100,000,000 USD or more$1,000,000,000 USD or more
Percentage of Supply
Balance0.000001 BTC or more0.00001 BTC or more0.0001 BTC or more0.001 BTC or more0.01 BTC or more0.1 BTC or more1 BTC or more10 BTC or more100 BTC or more1,000 BTC or more10,000 BTC or more100,000 BTC or more$0.01 USD or more$0.10 USD or more$1 USD or more$10 USD or more$100 USD or more$1,000 USD or more$10,000 USD or more$100,000 USD or more$1,000,000 USD or more$10,000,000 USD or more$100,000,000 USD or more$1,000,000,000 USD or more
Number of Addresses
0.000001 BTC or less0.00001 BTC or less0.0001 BTC or less0.001 BTC or less0.01 BTC or less0.1 BTC or less1 BTC or less10 BTC or less100 BTC or less1,000 BTC or less10,000 BTC or less100,000 BTC or less$0.01 USD or less$0.10 USD or less$1 USD or less$10 USD or less$100 USD or less$1,000 USD or less$10,000 USD or less$100,000 USD or less$1,000,000 USD or less$10,000,000 USD or less$100,000,000 USD or less$1,000,000,000 USD or less
Percentage of Addresses
0.000001 BTC or less0.00001 BTC or less0.0001 BTC or less0.001 BTC or less0.01 BTC or less0.1 BTC or less1 BTC or less10 BTC or less100 BTC or less1,000 BTC or less10,000 BTC or less100,000 BTC or less$0.01 USD or less$0.10 USD or less$1 USD or less$10 USD or less$100 USD or less$1,000 USD or less$10,000 USD or less$100,000 USD or less$1,000,000 USD or less$10,000,000 USD or less$100,000,000 USD or less$1,000,000,000 USD or less
Total Balance (BTC)
0.000001 BTC or less0.00001 BTC or less0.0001 BTC or less0.001 BTC or less0.01 BTC or less0.1 BTC or less1 BTC or less10 BTC or less100 BTC or less1,000 BTC or less10,000 BTC or less100,000 BTC or less$0.01 USD or less$0.10 USD or less$1 USD or less$10 USD or less$100 USD or less$1,000 USD or less$10,000 USD or less$100,000 USD or less$1,000,000 USD or less$10,000,000 USD or less$100,000,000 USD or less$1,000,000,000 USD or less
Total Balance (USD)
0.000001 BTC or less0.00001 BTC or less0.0001 BTC or less0.001 BTC or less0.01 BTC or less0.1 BTC or less1 BTC or less10 BTC or less100 BTC or less1,000 BTC or less10,000 BTC or less100,000 BTC or less$0.01 USD or less$0.10 USD or less$1 USD or less$10 USD or less$100 USD or less$1,000 USD or less$10,000 USD or less$100,000 USD or less$1,000,000 USD or less$10,000,000 USD or less$100,000,000 USD or less$1,000,000,000 USD or less
Average Balance (BTC)
0.000001 BTC or less0.00001 BTC or less0.0001 BTC or less0.001 BTC or less0.01 BTC or less0.1 BTC or less1 BTC or less10 BTC or less100 BTC or less1,000 BTC or less10,000 BTC or less100,000 BTC or less$0.01 USD or less$0.10 USD or less$1 USD or less$10 USD or less$100 USD or less$1,000 USD or less$10,000 USD or less$100,000 USD or less$1,000,000 USD or less$10,000,000 USD or less$100,000,000 USD or less$1,000,000,000 USD or less
Average Balance (USD)
0.000001 BTC or less0.00001 BTC or less0.0001 BTC or less0.001 BTC or less0.01 BTC or less0.1 BTC or less1 BTC or less10 BTC or less100 BTC or less1,000 BTC or less10,000 BTC or less100,000 BTC or less$0.01 USD or less$0.10 USD or less$1 USD or less$10 USD or less$100 USD or less$1,000 USD or less$10,000 USD or less$100,000 USD or less$1,000,000 USD or less$10,000,000 USD or less$100,000,000 USD or less$1,000,000,000 USD or less
Percentage of Supply
0.000001 BTC or less0.00001 BTC or less0.0001 BTC or less0.001 BTC or less0.01 BTC or less0.1 BTC or less1 BTC or less10 BTC or less100 BTC or less1,000 BTC or less10,000 BTC or less100,000 BTC or less$0.01 USD or less$0.10 USD or less$1 USD or less$10 USD or less$100 USD or less$1,000 USD or less$10,000 USD or less$100,000 USD or less$1,000,000 USD or less$10,000,000 USD or less$100,000,000 USD or less$1,000,000,000 USD or less
Number of Addresses
0.000001 - 0.00001 BTC0.00001 - 0.0001 BTC0.0001 - 0.001 BTC0.001 - 0.01 BTC0.01 - 0.1 BTC0.1 - 1 BTC1 - 10 BTC10 - 100 BTC100 - 1,000 BTC1,000 - 10,000 BTC10,000 - 100,000 BTC$0.01 - $0.10 USD$0.10 - $1 USD$1 - $10 USD$10 - $100 USD$100 - $1,000 USD$1,000 - $10,000 USD$10,000 - $100,000 USD$100,000 - $1,000,000 USD$1,000,000 - $10,000,000 USD$10,000,000 - $100,000,000 USD$100,000,000 - $1,000,000,000 USD
Percentage of Addresses
0.000001 - 0.00001 BTC0.00001 - 0.0001 BTC0.0001 - 0.001 BTC0.001 - 0.01 BTC0.01 - 0.1 BTC0.1 - 1 BTC1 - 10 BTC10 - 100 BTC100 - 1,000 BTC1,000 - 10,000 BTC10,000 - 100,000 BTC$0.01 - $0.10 USD$0.10 - $1 USD$1 - $10 USD$10 - $100 USD$100 - $1,000 USD$1,000 - $10,000 USD$10,000 - $100,000 USD$100,000 - $1,000,000 USD$1,000,000 - $10,000,000 USD$10,000,000 - $100,000,000 USD$100,000,000 - $1,000,000,000 USD
Total Balance (BTC)
0.000001 - 0.00001 BTC0.00001 - 0.0001 BTC0.0001 - 0.001 BTC0.001 - 0.01 BTC0.01 - 0.1 BTC0.1 - 1 BTC1 - 10 BTC10 - 100 BTC100 - 1,000 BTC1,000 - 10,000 BTC10,000 - 100,000 BTC$0.01 - $0.10 USD$0.10 - $1 USD$1 - $10 USD$10 - $100 USD$100 - $1,000 USD$1,000 - $10,000 USD$10,000 - $100,000 USD$100,000 - $1,000,000 USD$1,000,000 - $10,000,000 USD$10,000,000 - $100,000,000 USD$100,000,000 - $1,000,000,000 USD
Total Balance (USD)
0.000001 - 0.00001 BTC0.00001 - 0.0001 BTC0.0001 - 0.001 BTC0.001 - 0.01 BTC0.01 - 0.1 BTC0.1 - 1 BTC1 - 10 BTC10 - 100 BTC100 - 1,000 BTC1,000 - 10,000 BTC10,000 - 100,000 BTC$0.01 - $0.10 USD$0.10 - $1 USD$1 - $10 USD$10 - $100 USD$100 - $1,000 USD$1,000 - $10,000 USD$10,000 - $100,000 USD$100,000 - $1,000,000 USD$1,000,000 - $10,000,000 USD$10,000,000 - $100,000,000 USD$100,000,000 - $1,000,000,000 USD
Average Balance (BTC)
0.000001 - 0.00001 BTC0.00001 - 0.0001 BTC0.0001 - 0.001 BTC0.001 - 0.01 BTC0.01 - 0.1 BTC0.1 - 1 BTC1 - 10 BTC10 - 100 BTC100 - 1,000 BTC1,000 - 10,000 BTC10,000 - 100,000 BTC$0.01 - $0.10 USD$0.10 - $1 USD$1 - $10 USD$10 - $100 USD$100 - $1,000 USD$1,000 - $10,000 USD$10,000 - $100,000 USD$100,000 - $1,000,000 USD$1,000,000 - $10,000,000 USD$10,000,000 - $100,000,000 USD$100,000,000 - $1,000,000,000 USD
Average Balance (USD)
0.000001 - 0.00001 BTC0.00001 - 0.0001 BTC0.0001 - 0.001 BTC0.001 - 0.01 BTC0.01 - 0.1 BTC0.1 - 1 BTC1 - 10 BTC10 - 100 BTC100 - 1,000 BTC1,000 - 10,000 BTC10,000 - 100,000 BTC$0.01 - $0.10 USD$0.10 - $1 USD$1 - $10 USD$10 - $100 USD$100 - $1,000 USD$1,000 - $10,000 USD$10,000 - $100,000 USD$100,000 - $1,000,000 USD$1,000,000 - $10,000,000 USD$10,000,000 - $100,000,000 USD$100,000,000 - $1,000,000,000 USD
Percentage of Supply
0.000001 - 0.00001 BTC0.00001 - 0.0001 BTC0.0001 - 0.001 BTC0.001 - 0.01 BTC0.01 - 0.1 BTC0.1 - 1 BTC1 - 10 BTC10 - 100 BTC100 - 1,000 BTC1,000 - 10,000 BTC10,000 - 100,000 BTC$0.01 - $0.10 USD$0.10 - $1 USD$1 - $10 USD$10 - $100 USD$100 - $1,000 USD$1,000 - $10,000 USD$10,000 - $100,000 USD$100,000 - $1,000,000 USD$1,000,000 - $10,000,000 USD$10,000,000 - $100,000,000 USD$100,000,000 - $1,000,000,000 USD
Bitcoin & AppleBitcoin & TeslaBitcoin & NVIDIABitcoin & Facebook (META)Bitcoin & Google (Alphabet)Bitcoin & MicroStrategy
Bitcoin & Fidelity ETFBitcoin & ARK Bitcoin ETFBitcoin & Bitwise Bitcoin ETFBitcoin & ProShares Bitcoin ETFBitcoin & Grayscale Bitcoin TrustBitcoin & VanEck Bitcoin ETFBitcoin & Invesco Galaxy Bitcoin ETFBitcoin & Grayscale Ethereum TrustBitcoin & Super Micro ComputerBitcoin & Arm Holdings PLCBitcoin & iShares Ethereum ETFBitcoin & Valkyrie Bitcoin FundBitcoin & Franklin Bitcoin ETFBitcoin & SoundHound IncBitcoin & CleanSpark Inc


